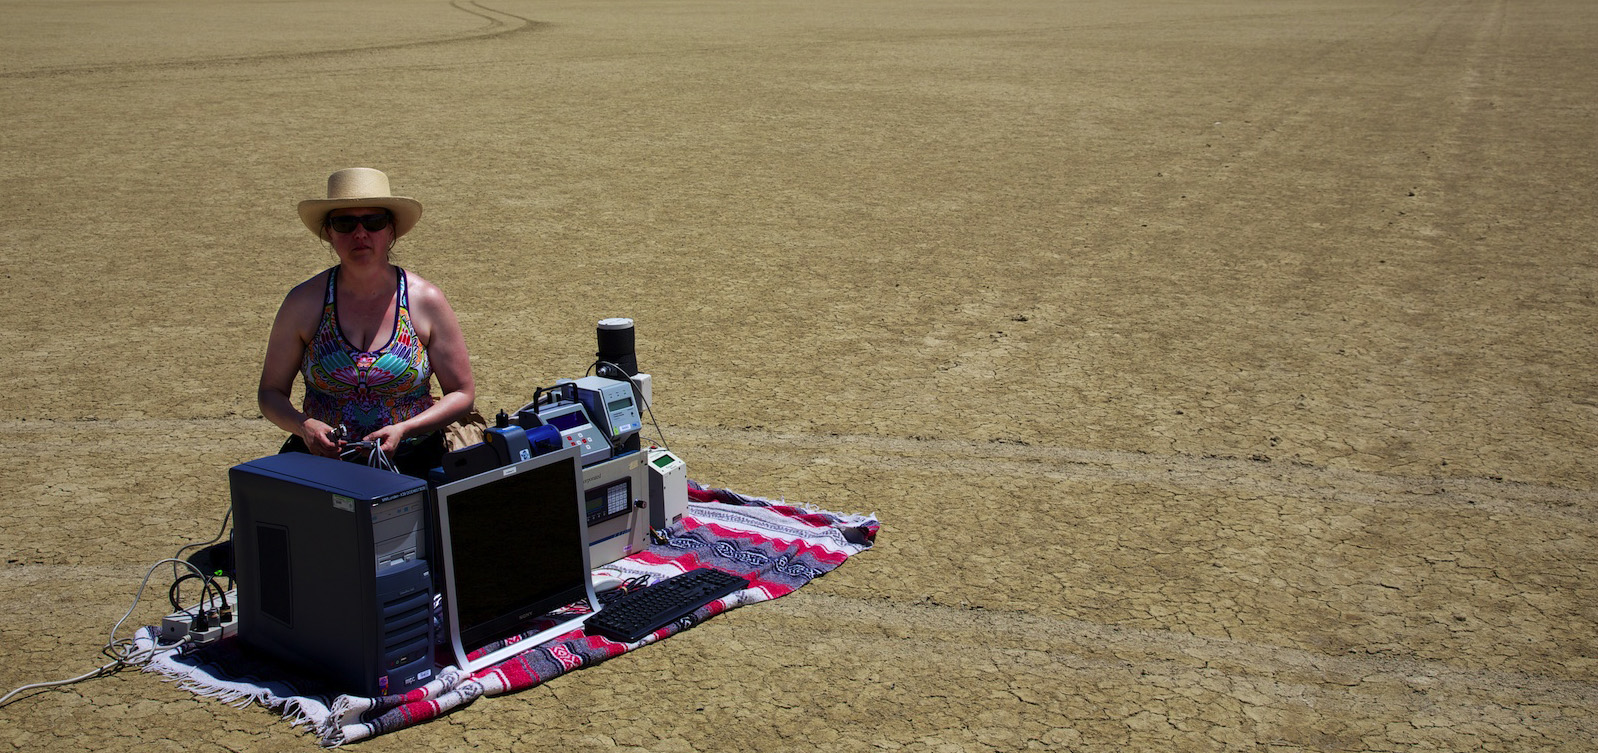
We visited the Black Rock Desert on June 1st to test our equipment and to get our first baseline measurements. We wanted these initial measurements to occur before the event was underway and while the playa had a minimal population. (Note: The Black Rock Desert is often called ‘the playa’, a generic term for a dry lake bed, and that’s how we will refer to it in this article.)
Almost immediately, our data analysis computer (or possibly just its display) stopped working. (The shake-down was working! We recorded our first success!) Luckily, we had three instruments that recorded data internally:
- MetOne – records particle concentration in particles/liter for particles in six size bins: from 0.3 to 0.5 micrometers (0.5 – 0.7, 0.7 – 1.0, 1.0 – 2.0, 2.0 – 5.0, and 5+ microns).
- Condensation Particle Counter (CPC) – measures the total particle concentration in particles/cm3 from particles of around 6 nanometers and above.
- Dusttrak – total particle mass in milligrams/cubic meter.
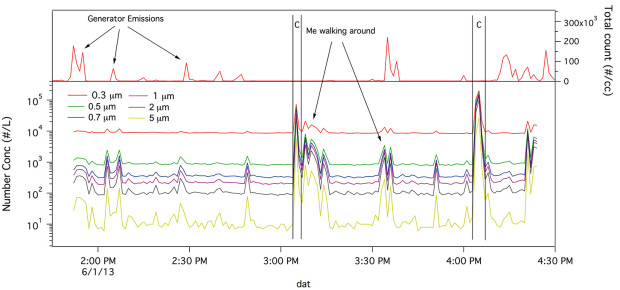
Each instrument is more-or-less sensitive to different types of particles. I will discuss about how the particle sources affect the data we measured on the playa. Here is a graph of the concentrations measured with the CPC and MetOne measured somewhere in the middle of the playa.
Small-ish particles, less than 100 to 200 nanometers, tend to dominate the total particle concentration, thus the measured concentrations from the CPC are most sensitive to these small particles. This sensitivity can be seen in the playa data. The occasional spikes in the CPC data are almost certainly due to emissions from the diesel generator blowing in the direction of the instruments. (The wind was low and variable, so the air that the instruments were sampling came from different directions.)
The MetOne measures particles from 0.3 to 5 micrometers in diameter, so the concentrations measured by the MetOne will usually not correlate with the concentrations measured by the CPC. The MetOne seems to be sensitive to playa dust. The spikes in concentration measured by the MetOne seem to be caused by my walking around the area – and thrashing up puffs of dust while practicing my whipcracking skills. There were two times that Ron drove in tight circles around the instruments marked on the graph by two vertical lines denoted by a ‘C‘. (Note that the number concentration is shown on a log scale, where each tick of the graph denotes a concentration that is 10 times the previous tick.) The dust kicked up from the car clearly resulted in the largest response from the MetOne. And Ron had a fun time doing it.
When you look at the figure with the MetOne and CPC data, you can see that the spikes in number concentration measured by the two instruments are not usually correlated in time. This is another indication that the instruments are responding to two different sources of particles. When they are correlated, it is coincidental. For instance, the particle increases measured just after 3:30 was my walking away from the instruments in the same approximate direction as the generator, and it looks like the wind was blowing from that direction.
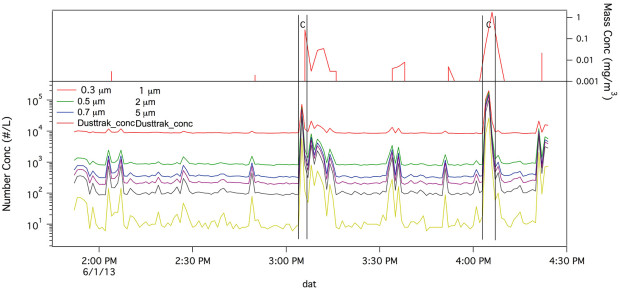
The Dusttrak is sensitive to total particle mass. The mass of a particle is proportional to the cube of the particle diameter, Dp3, so the measured mass concentration is much more sensitive to the larger particles. For instance, a particle 1 micrometer in diameter has 8 times the mass of a particle with a diameter of 0.5 microns, and a particle with a diameter of 5 micrometers has 1000 times the mass of the particle 0.5 microns in diameter. You can see this reflected in the playa data. This graph shows the same MetOne date, but with the dusttrak concentrations plotted instead of the CPC data. The dusttrak only really shows a significant response when the playa dust is really getting kicked up, like when Ron was driving around the instruments. (The dustrak data is also shown on a log scale.)
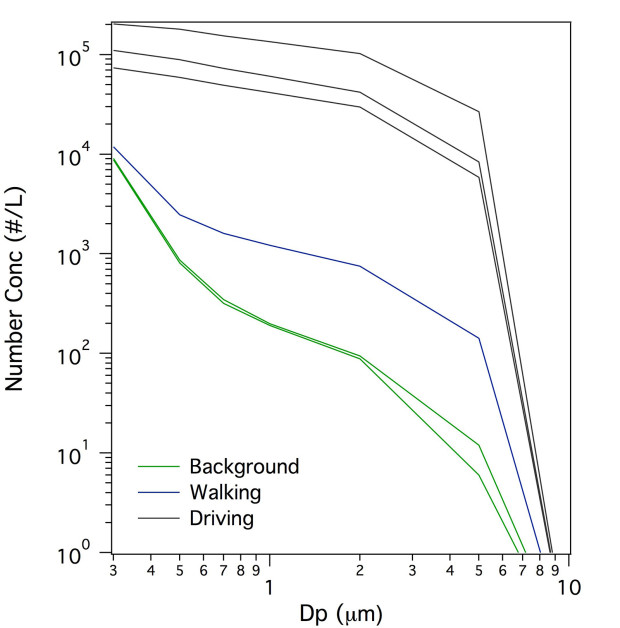
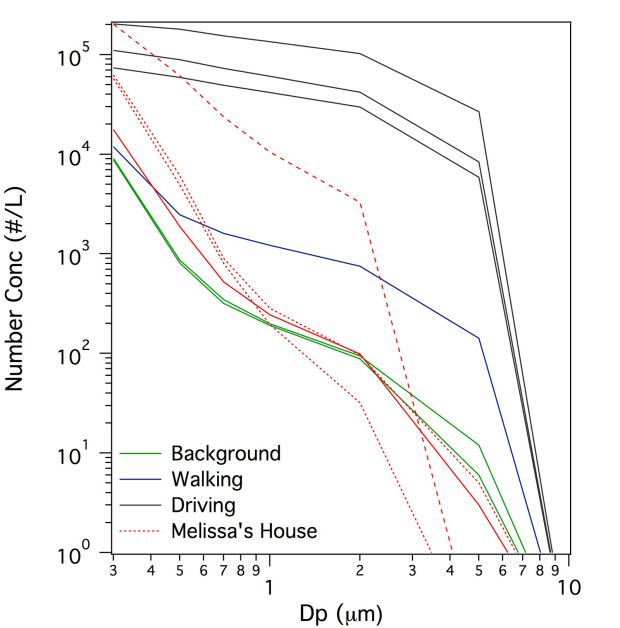
I plotted up a few of the individual MetOne measurements as the measured concentration as a function of particle diameter. This gives a broad idea of what the particle size distribution looks like for that measurement, which is an indication of the source.
The graph shows size distributions from three different time periods; some of the general background (nothing is happening), one where I my walking was affecting the measurement, and some from when Ron was madly driving around the instruments. The plots show that there is a higher concentration of particles in the 0.3 micron bin, and the concentration drops off as the particle size decreases. The two activities, walking and driving, increase the number concentration in each size bin. However the response in the larger size bins, from 1 micron to 5 microns, is much larger than in the smaller size bins. This means that walking, driving, etc., resuspend larger particles – the larger particles are easier to kick back into the air.
I had a MetOne in my house for a period of time last fall, and I added a few of those distributions to demonstrate the difference between what we measured on the playa to what you might see in a home.
The solid red line is a size distribution measured is a typical one measured when there was no particular activity happening indoors. It is not that different from the background playa size distribution, with a slightly higher concentration at smaller particle sizes. The dotted distributions (there are two) were measured while I was cooking. Cooking caused a moderate increase in the number concentration of particles in the 0.3, 0.5, and 0.7 size bins. The dashed line is a time period when I was doing some Thanksgiving prep, and I was doing some serious pan frying I think. The number concentration of particles below 2 microns is about a factor of ten larger than the typical household values. (This is why it is important to use a range hood while cooking. You make a lot of particles, and you really don’t want to breath this in. Seriously.)
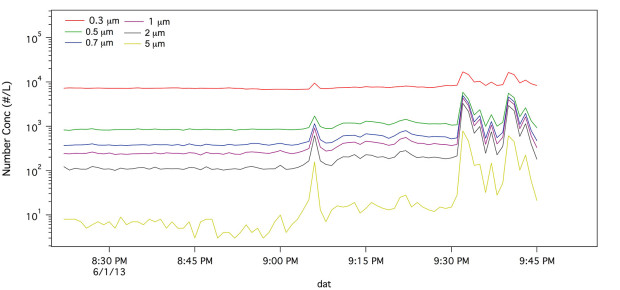
One final plot to give you all a feel for what we measured and what the numbers mean… The MetOne runs well on batteries, so we left the instrument outside near the car while we wandered off to the hot springs. We left the instrument at approximately 8:20 PM and walked off. There is an interesting spike in the data at around 9:05. The only thing that I can think of to explain this is some creature wandering nearby that kicked up some dust. The number concentrations seem to rise after at 9 PM, which I think is due to the wind kicking up a bit in the evening. I am not entirely sure what started to happen at 9:30. We were walking back to the car, but we were pretty far away at this time. I could be that the wind was blowing in the proper direction to carry any dust we kicked up toward the instrument.
